Total IDE Visibility

Dedicated 4-Tab Tool Window

A unified command center docked at the bottom of your IDE. Monitor Git operations in real time, inspect assigned tasks, visualize branch topologies, and track CI/CD builds.

Live Output & Telemetry

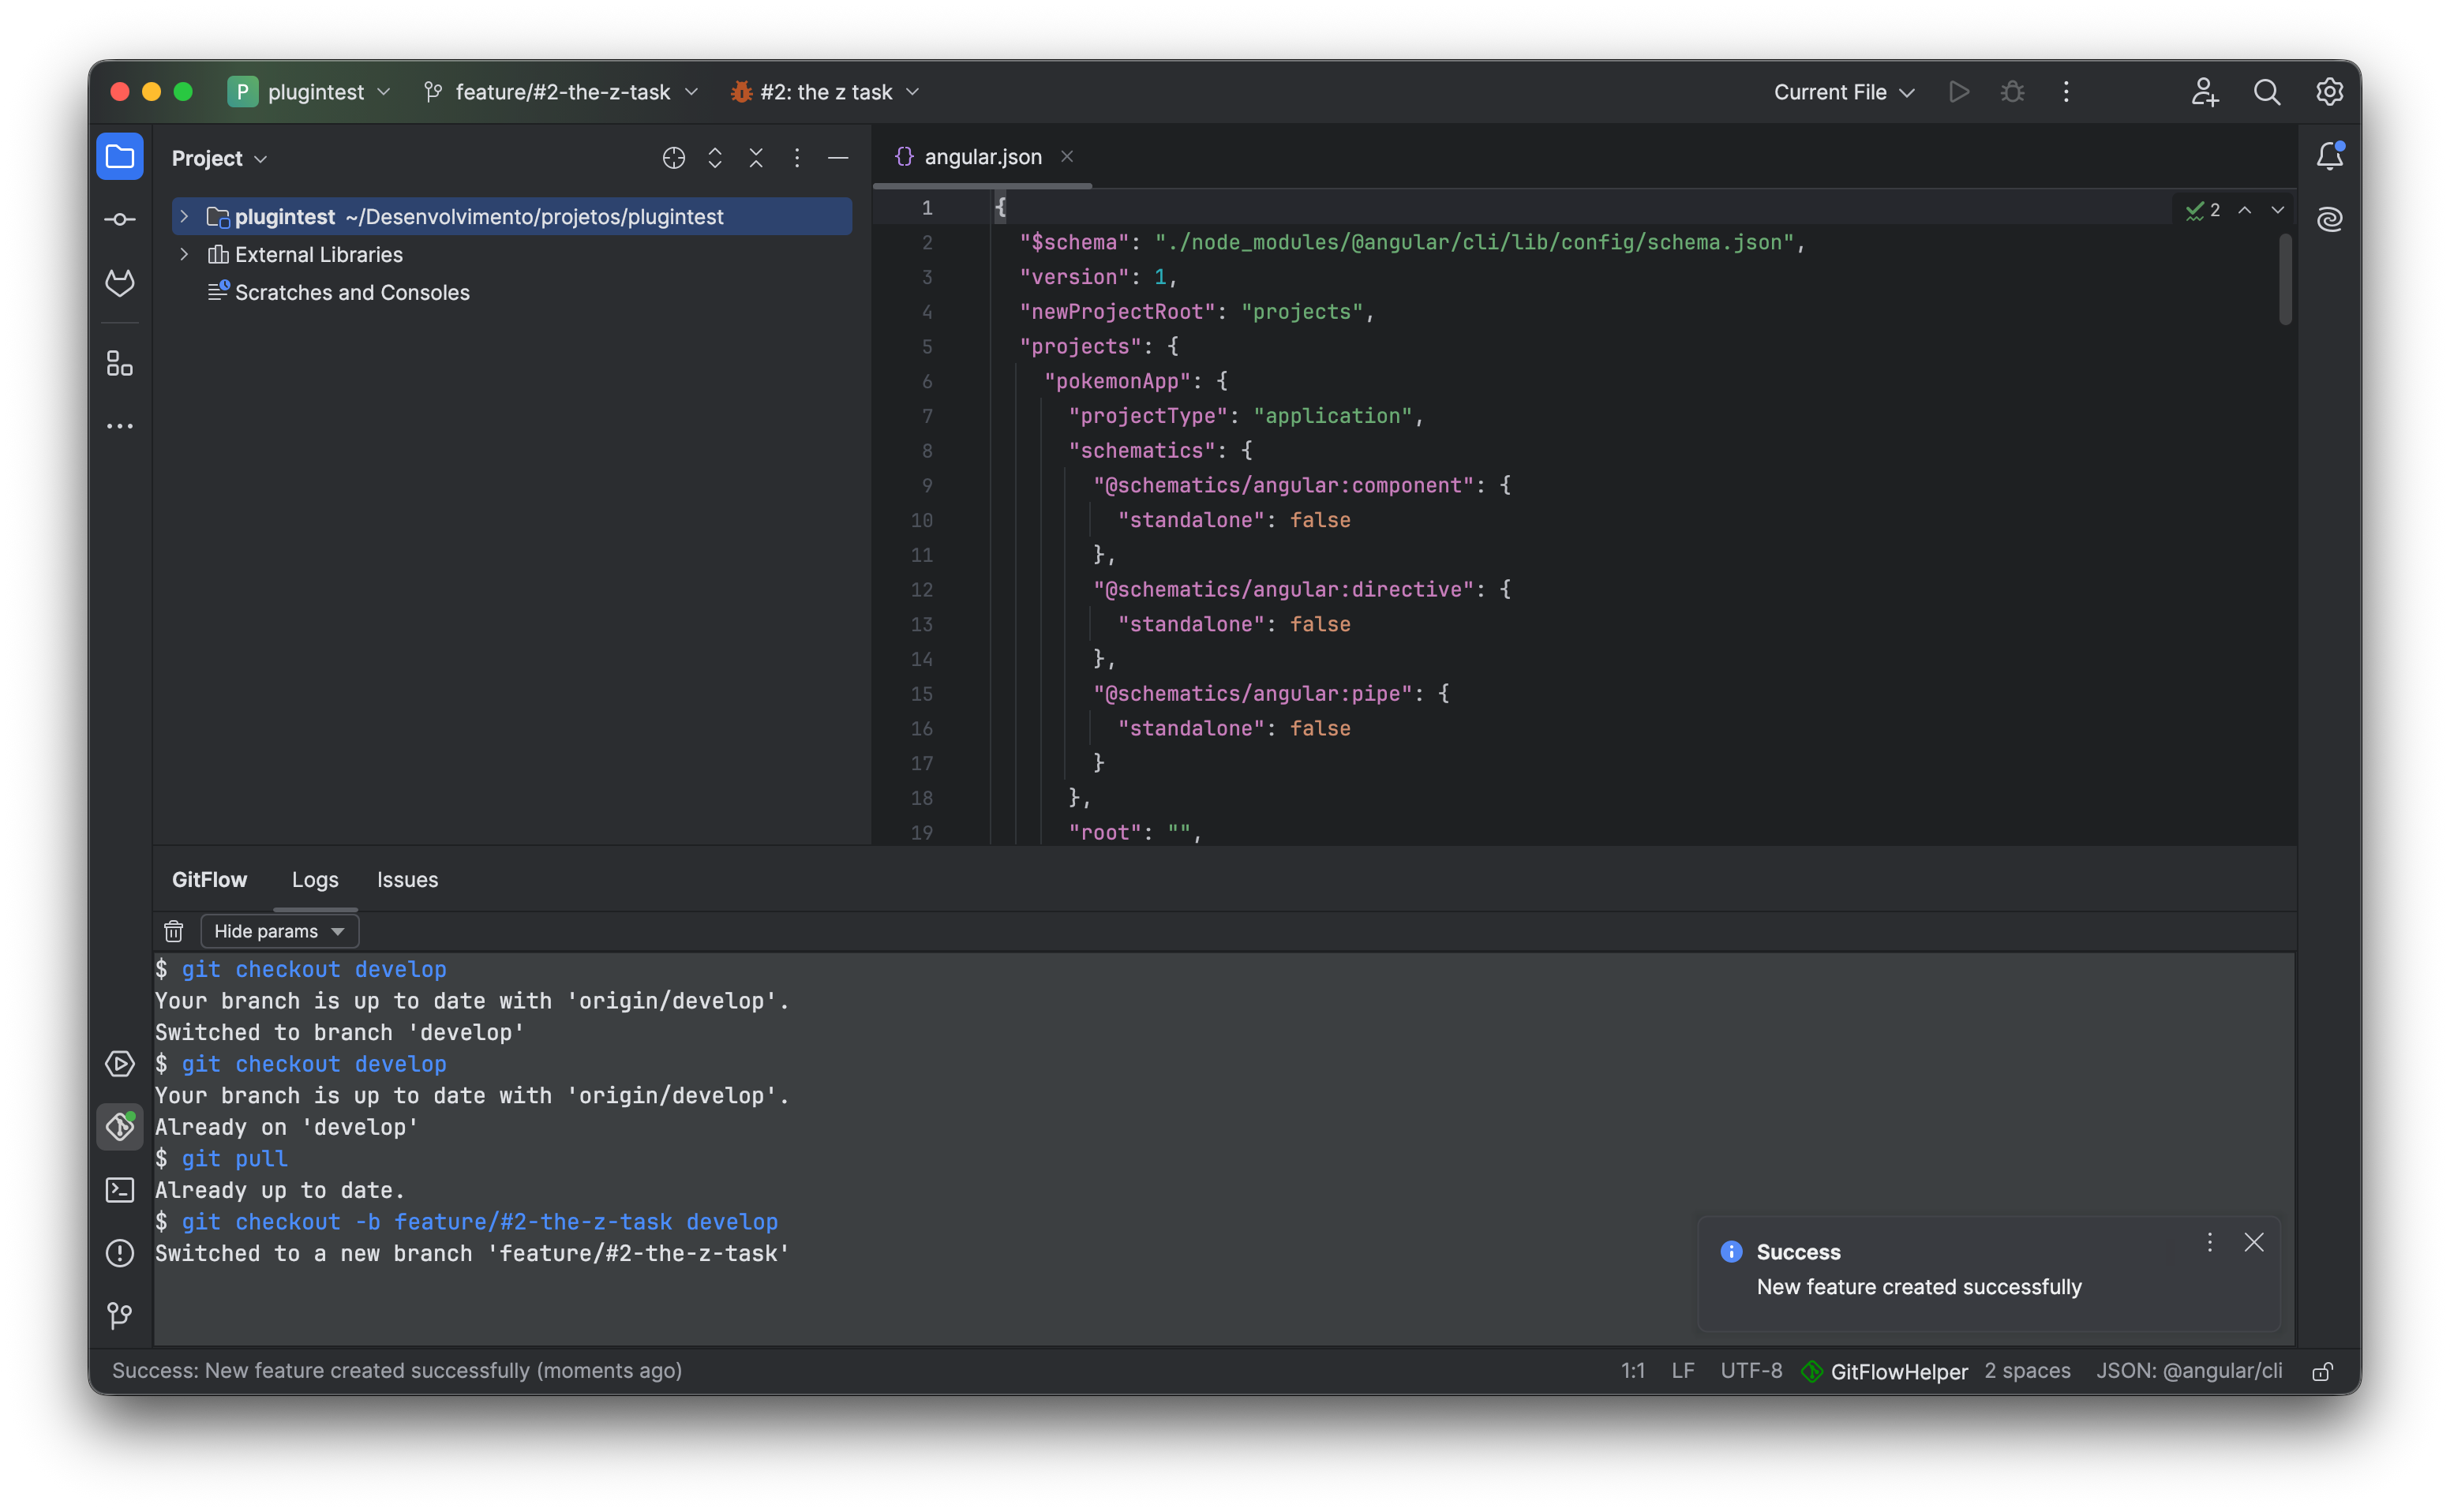
Real-Time Execution Logs

Never guess what Git commands are running under the hood. The Logs tab displays every single Git operation asynchronously executed by the plugin, complete with exact parameters, stdout, stderr, and exit codes.

  • ✓ Customizable Typography: Choose your favorite font family and adjust font size directly inside the tool window settings.
  • ✓ Multi-Repository Tagging: Clear repository prefix tags in multi-root workspaces to identify which repository triggered each command.
  • ✓ Live Status Indicator: Animated spinner on the tool window tab whenever background tasks are actively running.
📜toolwindow-logs-view.png
📜
Screenshot Placeholder: Tool Window Logs Tab
Place the screenshot showing the Logs tab with Git command stream, timestamped outputs, repository prefix, and font customization controls.
1200 × 650 px • PNG
Asynchronous execution logs with customizable font size and family Tab: Logs
Topological Visualization

Interactive Visual Flow Diagram

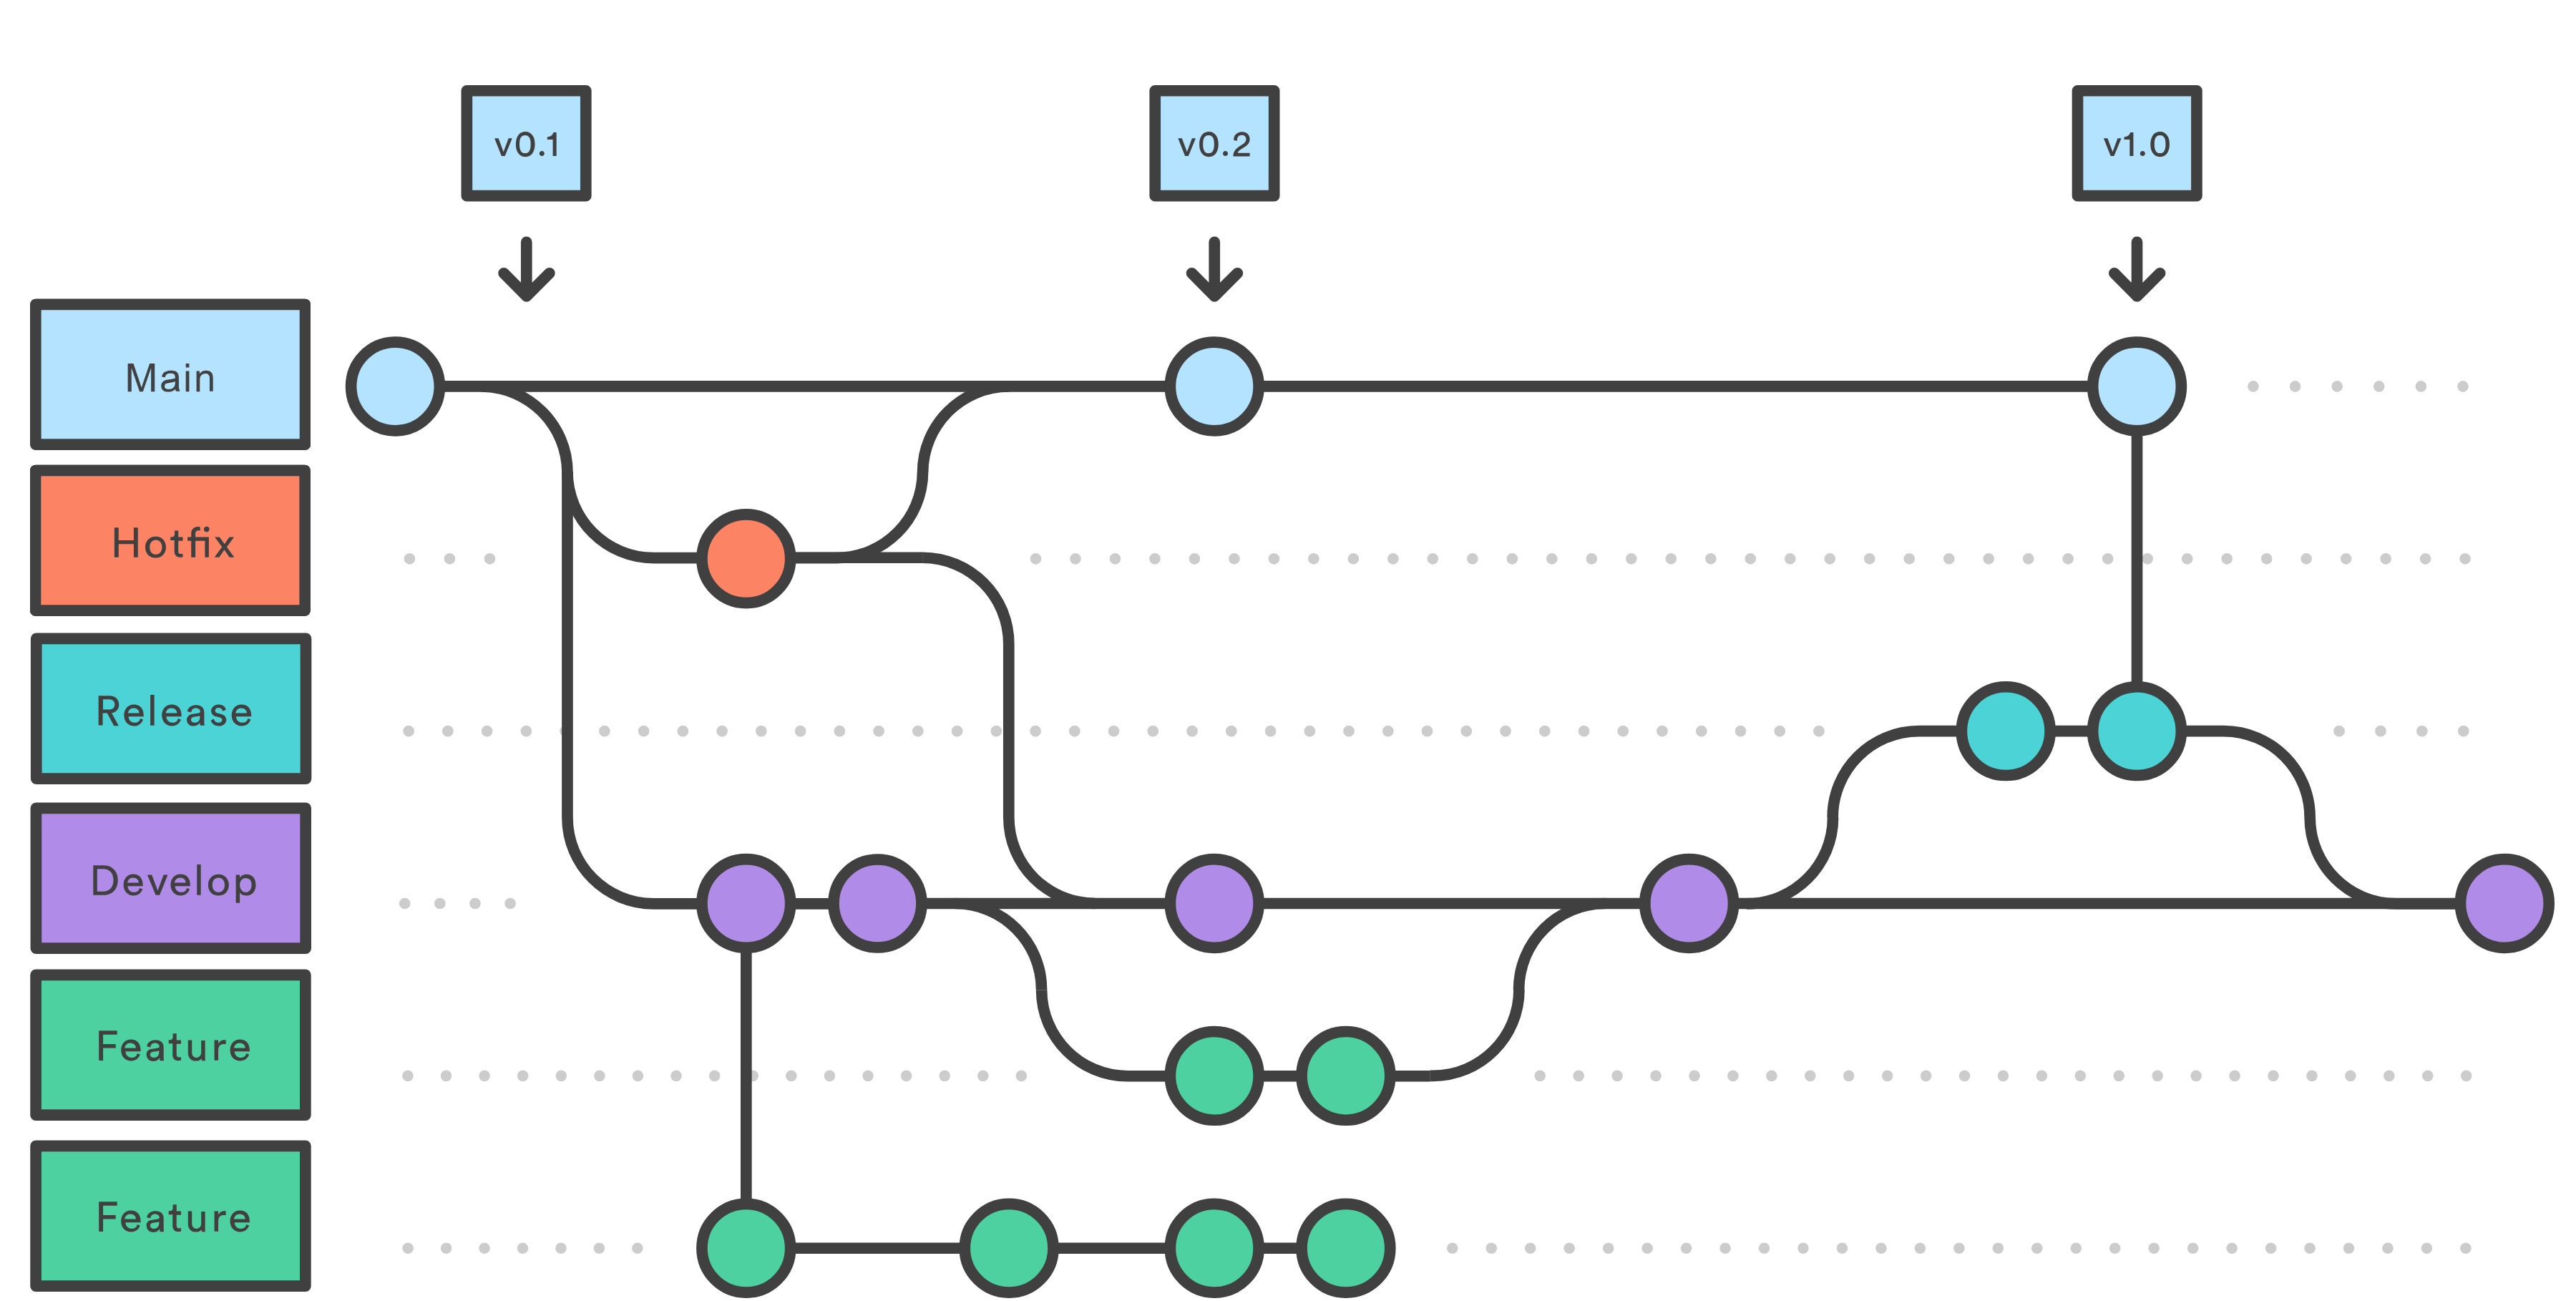
See your active branch state at a glance. The Flow tab generates an interactive topological map of all local and remote branches in your Git repository.

  • ● Main: Blue production line with release tags.
  • ● Develop: Emerald green integration line.
  • ● Features: Amber branches showing current work in progress.
  • ● Releases & Hotfixes: Cyan and red tracks with convergence markers.
🌿toolwindow-flow-graph.png
🌿
Screenshot Placeholder: Visual Flow Graph
Place the screenshot showing the interactive GitFlow branch diagram with color-coded branches, active head indicator, and origin connections.
1200 × 650 px • PNG
Interactive visual graph of local branches and checkout points Tab: Flow
Integrated Task Server

Issues & Tasks Inspector

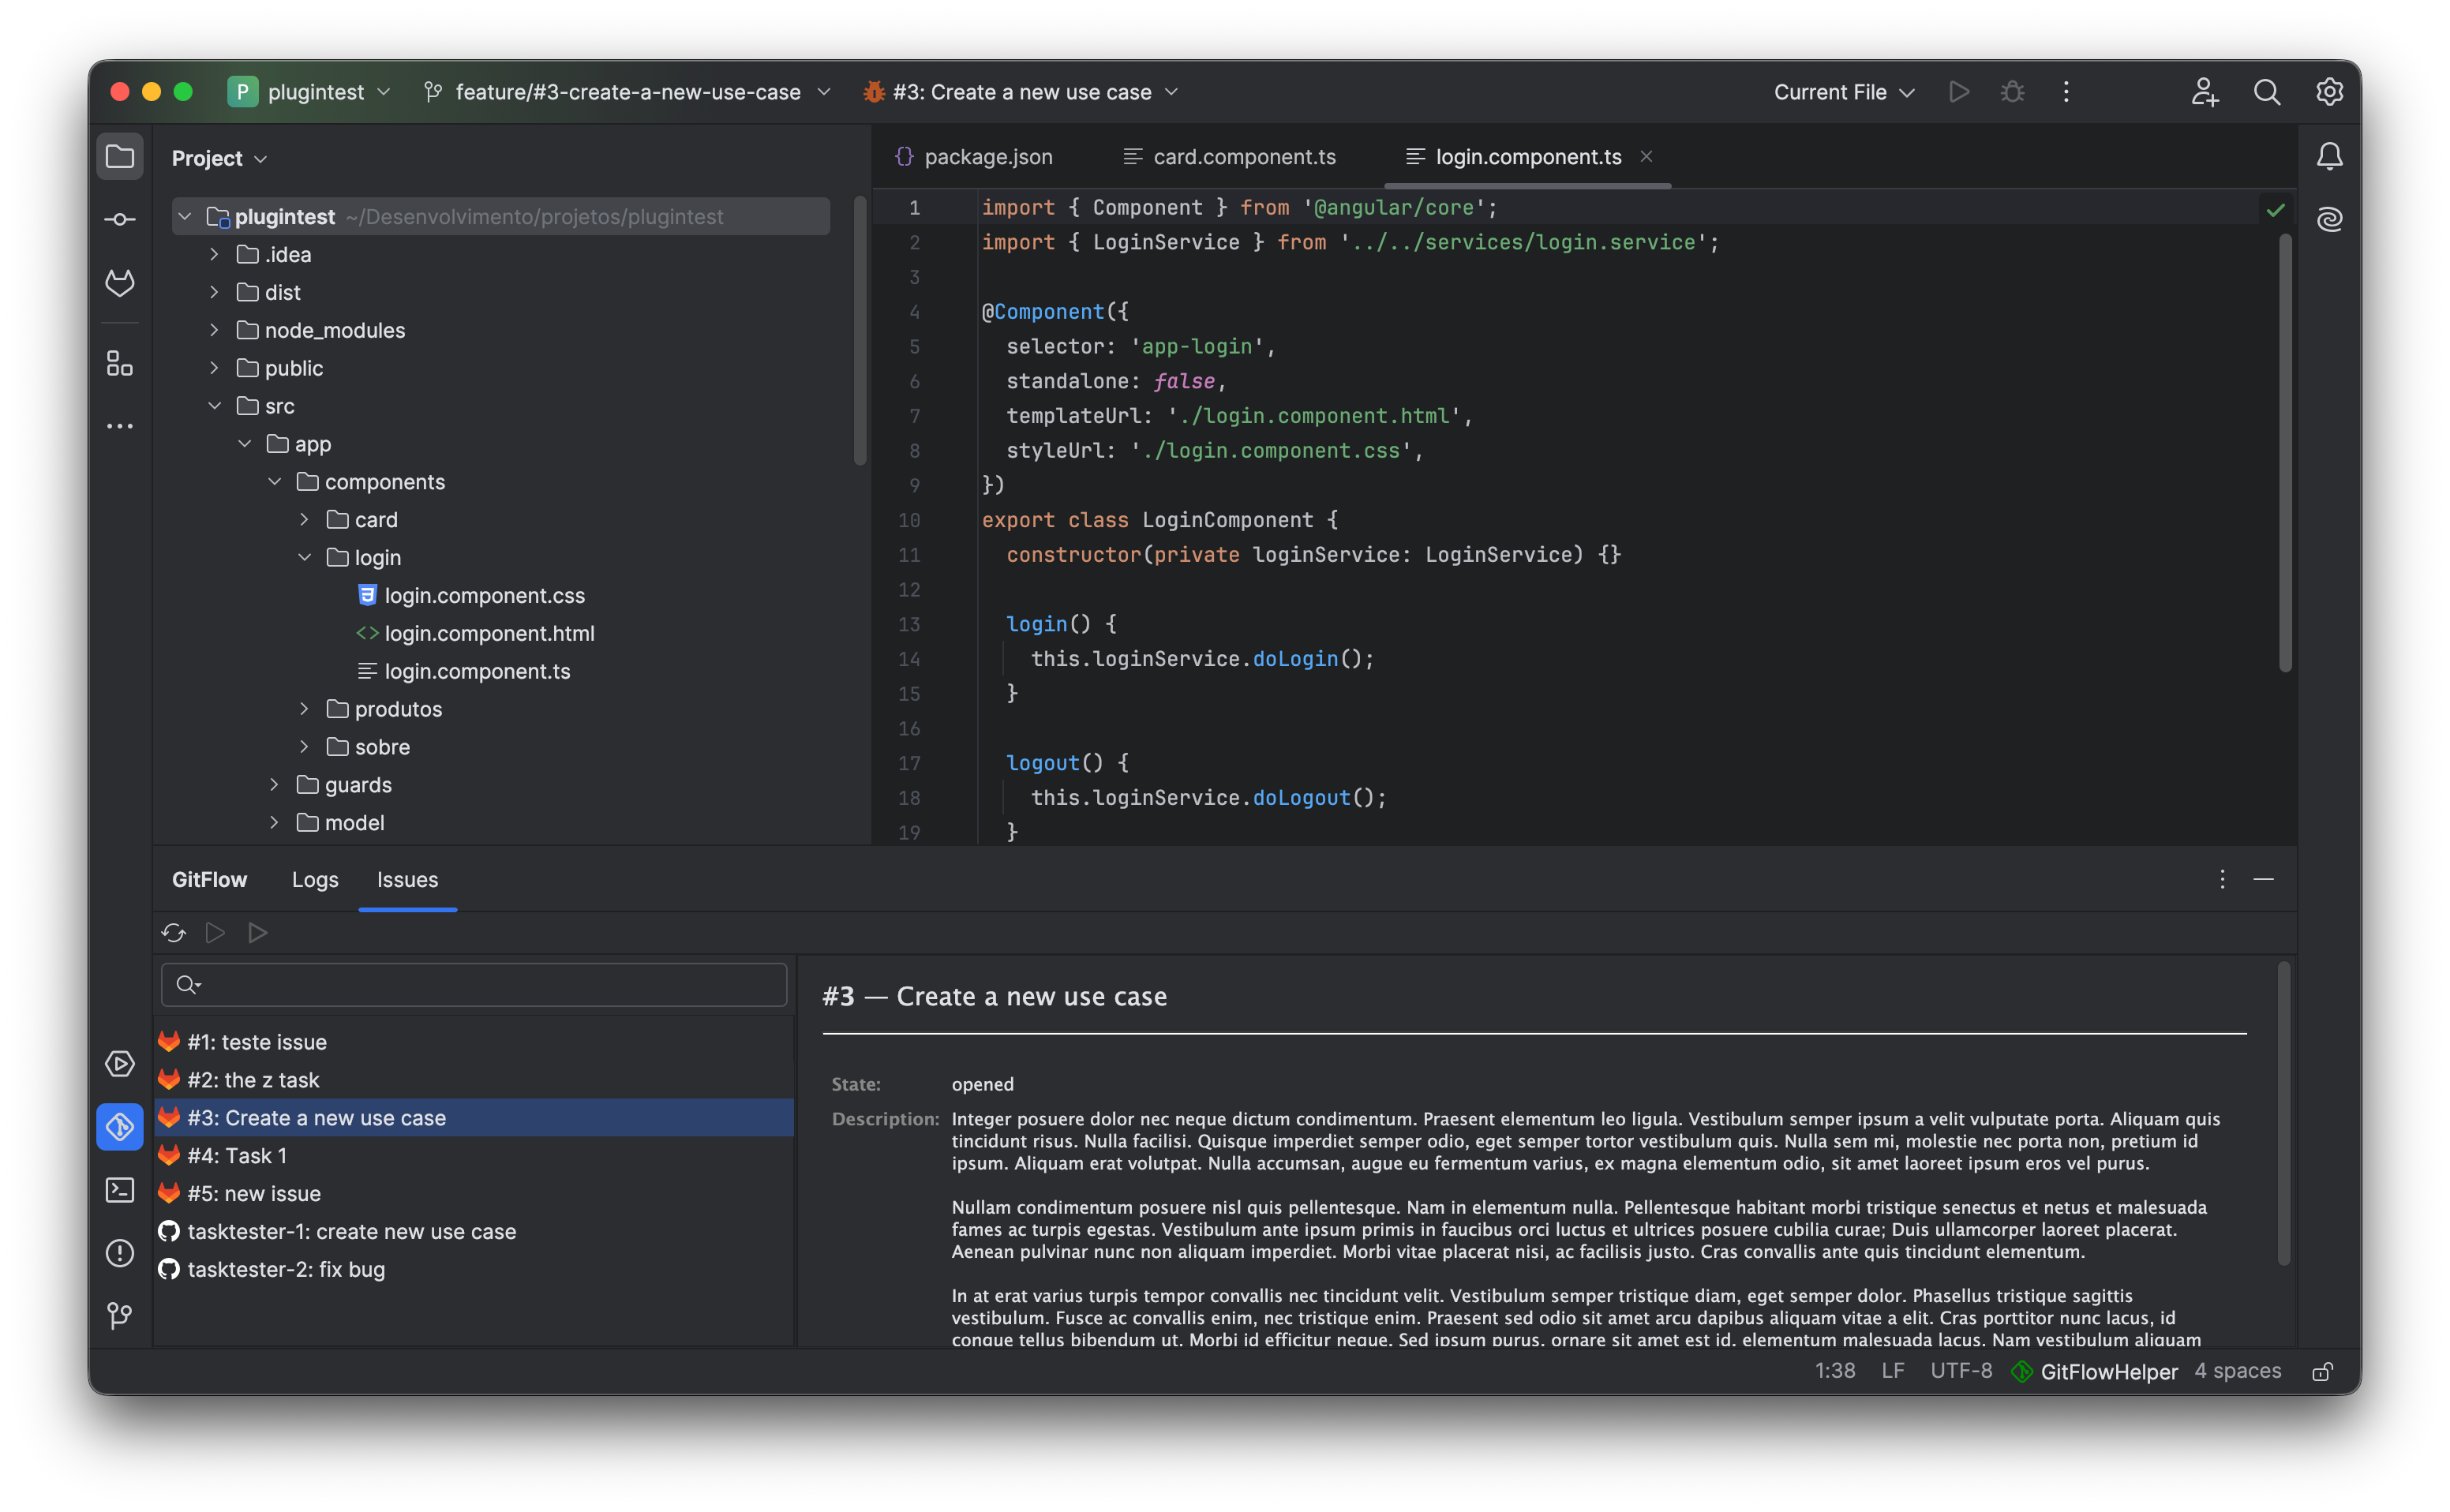
Browse assigned tickets from Jira, GitHub, GitLab, or Redmine directly within the IDE. View ticket descriptions, recent comments, and start branches with one click.

  • ✓ Side-by-Side Dual Pane: Task list on the left with detailed rich inspector on the right.
  • ✓ Instant Branch Creation: 'Start Feature' or 'Start Hotfix' buttons directly inside ticket details.
  • ✓ Quick Browser Shortcut: Click to jump straight to the issue URL in your default browser.
📋toolwindow-issues-tab.png
📋
Screenshot Placeholder: Issues & Tasks Tab
Place the screenshot showing the Issues tab with assigned task cards, description panel, and direct 'Start Feature' action buttons.
1200 × 650 px • PNG
Side-by-side task inspector connected to Jira, GitHub, GitLab, and Redmine Tab: Issues
Continuous Integration

CI/CD Pipeline Monitoring

Stay in your coding zone while tests and deployment jobs execute. The CI/CD tab connects to Jenkins pipelines to give you real-time build telemetry without browser tab switching.

  • ✓ Live Console Streaming: Progressive terminal output streaming with intelligent ANSI color highlighting.
  • ✓ Build Trigger & Status: Trigger new builds upon publishing or finishing branches and observe build status badges.
  • ✓ Secure Authentication: Credentials stored safely using IntelliJ's encrypted PasswordSafe subsystem.
🚀toolwindow-cicd-jenkins.png
🚀
Screenshot Placeholder: Jenkins CI/CD Tab
Place the screenshot showing the Jenkins CI/CD pipeline monitoring tab with live console chunk streaming and build status indicator.
1200 × 650 px • PNG
Live Jenkins pipeline execution and console log streaming Tab: CI/CD
💖 Developer Love

Enjoying the 4-Tab Tool Window?

Building and maintaining native IntelliJ platform plugins takes ongoing effort and testing across IDE versions. If GitFlow Helper makes your work enjoyable, support the project with a coffee!